As a CEO, when you review the slides for the next BOD meeting, review them as if you were the VC board member.
Board members see 8-10 portfolio companies and need to report to their bosses how they do.
If you were on our board, what level of information would you like to see?
Said differently, if you think more than three points will be remembered from any slide, you are very optimistic 😉
If you made more than 5 points on a slide, you should assume it will be skimmed. Nothing personal, but the board members want soundbites, and high-level summary.
They are not interested in the “to do” list. They assume the team knows what they are doing, and know how to run a company.
They want to see the insights of what you are doing, and see a trend.
Give them the info they need, which will also help them provide good advice.
When you prepare your slides for your BOD meeting:
1) Avoid sending your to do list, or rather the list of things you did since the last meeting.
2) Summarize in no more than three bullets what is the meaning of the sum of things you did / why/ how it ties to your strategy
3) Have one image you want them to remember with your slide, to help bring the point home.
Here is an example of how the same information can be conveyed (using generic roles)
Finance/CFO:
TMI = details, details, details.. TMI means Too Much Information.
Board level = one summary slide (in addition to details in the appendix), that tells the story:
Our cash low point is June 2019 based on 0 new sales
Our case low point is Dec 2019 based on executing our worse case board plan
While it is true that these insights are “buried” in the details, your job is to make it clear to the management team and then the board. Tease out the highest level information from the details. Don’t assume everyone will read every detail, analyze it and get to the “aha”. It is your job to do that, and the job of the management team. The board’s job is to help stir you in the right direction based on these insights.
Engineering:
TMI = list of features that were released since that last meeting.
Board level = one summary slide with the meaning of these features:
We are now compliant with the new regulation with the release of v3.x
We will be able to save $X by switching to another cloud service
We can run now on both Android and iOS, increasing our market reach
Marketing:
TMI = list of what we did since last time (can be listed in the appendix)
Board level = what is the objective of these activities, and how they drive the strategy:
We have begun a campaign to capture non-profits, as we see them as a key websites to spread the message
We are positioning the company to also message our “give back” efforts, as it will help drive our X objective
Campaigns are slated for Q3 to target our buyers (airport ads during the industry show)
Re-positioning towards our new focus is slated to begin on (date), with chosen vendor (Acme Co)
Design/Product
TMI = list of what we did since last time (can be in the appendix)
Board level = how we are delivering what the sales/business needs to win:
Campaign on UX thought leadership will help us with digital transformation influencers
Pricing to align our new focus is tested with verticals X/Y/Z
Working on a starter guide to make our implementations faster, and more mature/credible/delightful
Why?
While you are also a board member, you see the business every day, and may not see the aggregate picture, the sum of all the activities.
One of Eugene Kleiner’s rules was “you can’t see picture from inside the frame.” You are in the business every day, you ARE the business. So it is harder for you and the team to see what is going on. The advantage of a board member who gets a snapshot every 6-8 weeks, it so see a “strobe-light” view of the business. That can pinpoint trends and the general health of the business better than daily updates.
Not convinced? Here is an example based on companies you know.
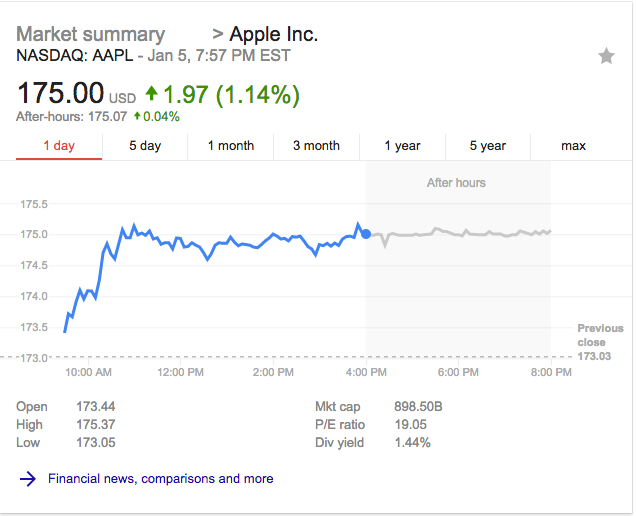
Here is Apple’s stock chart for one day.
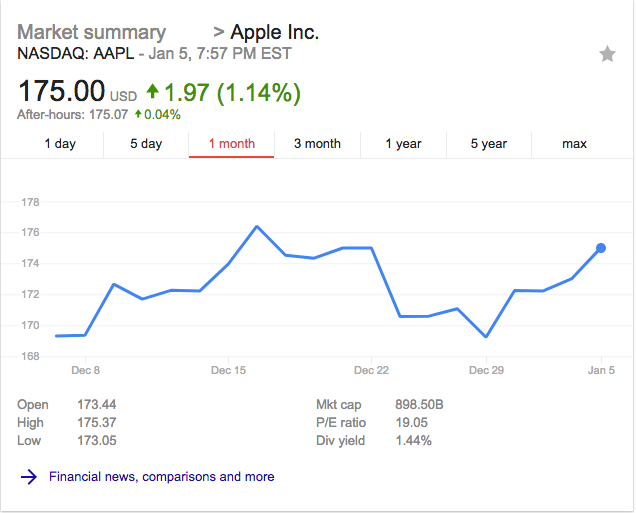
For one month.
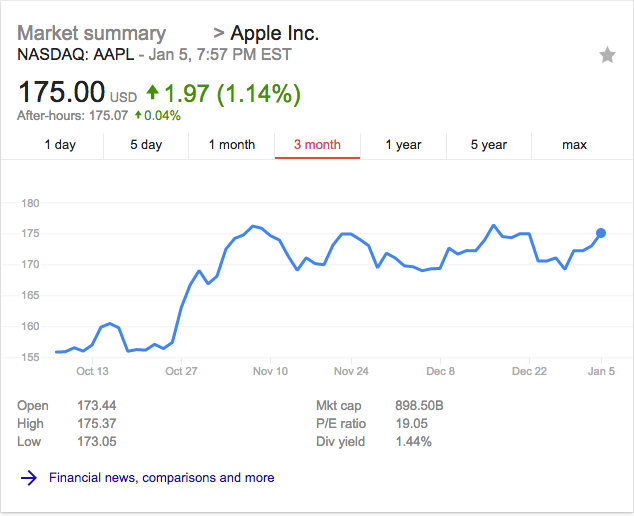
For one quarter.
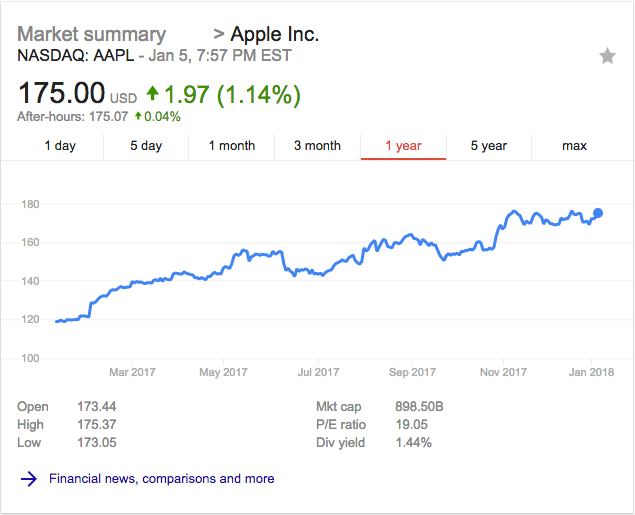
For one year.
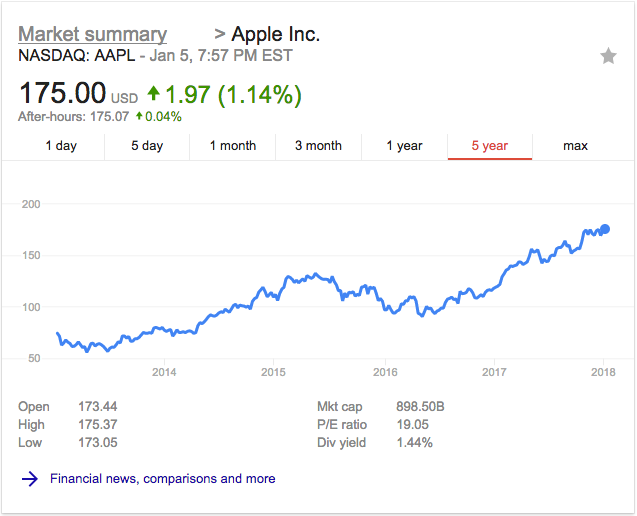
For five years.
For all time.
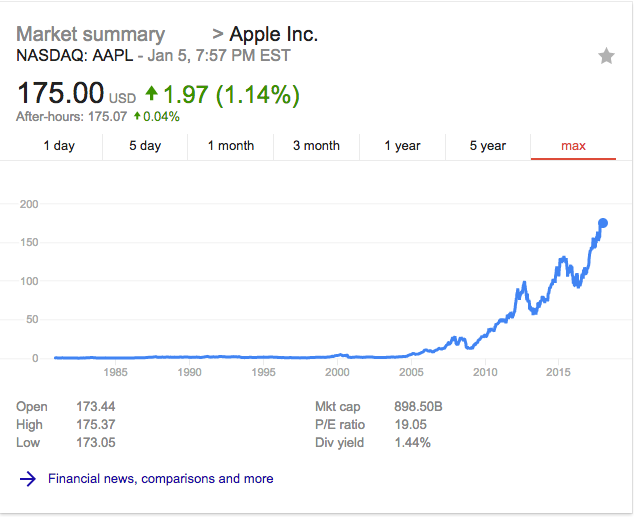
Which chart was most telling about Apple’s overall trend and health?
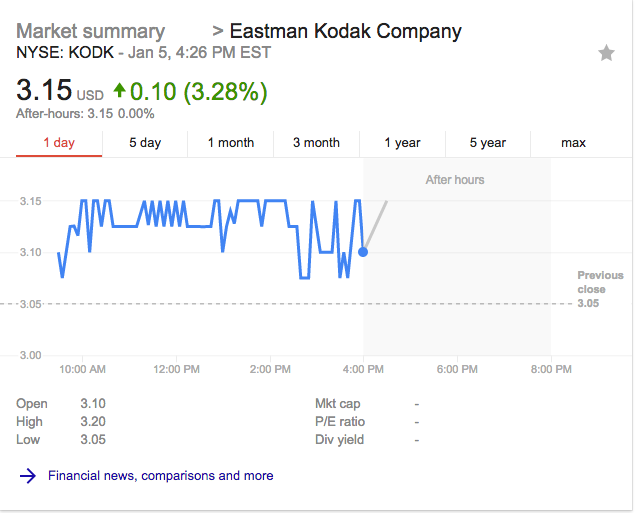
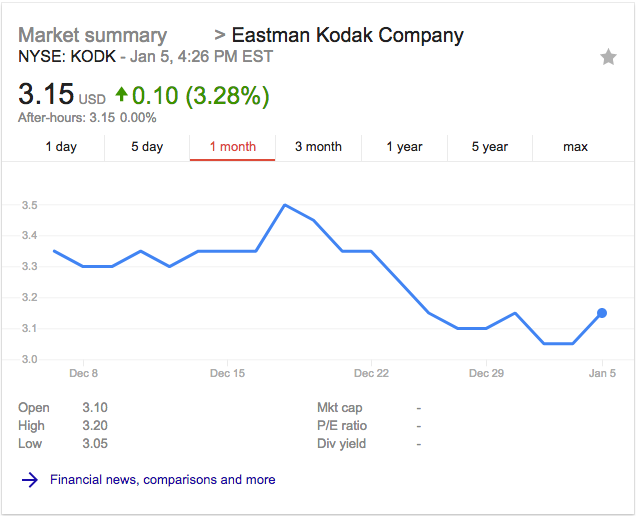
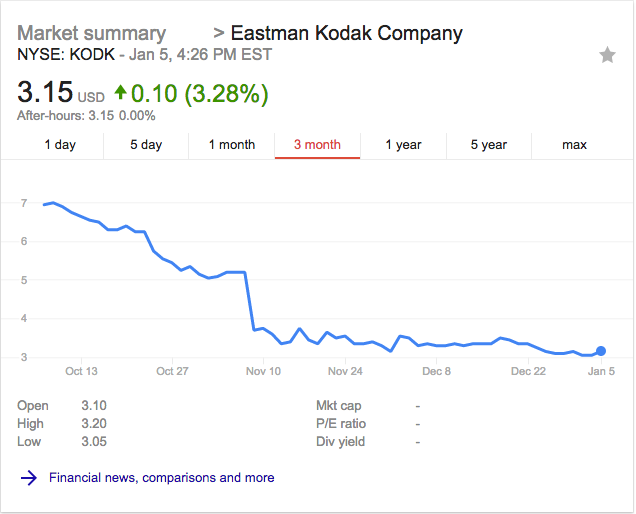
Let’s look at snapshots of Kodak’s performance. The daily and monthly views, may not show the real picture.
Here is Kodak’s stock chart for one day.
For one month.
For one quarter.
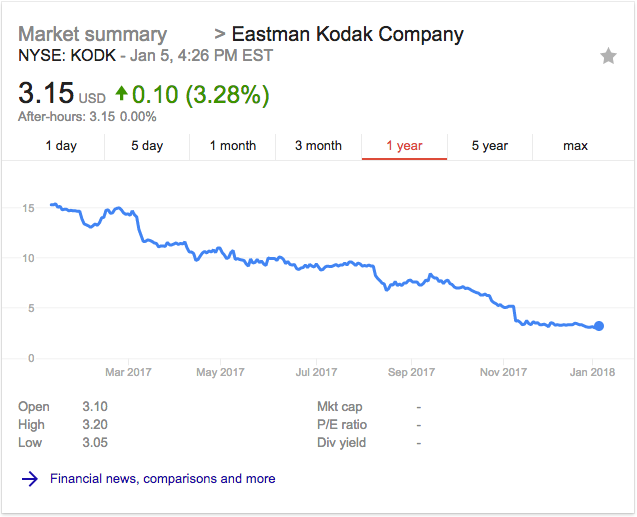
For one year.
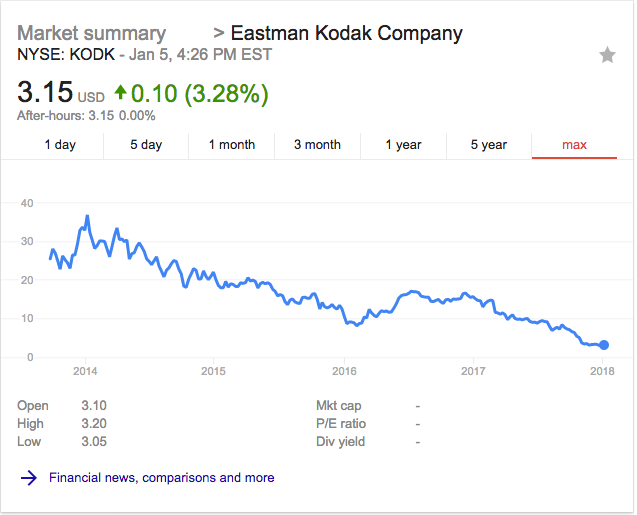
For all time.
In conclusion:
Ask yourself what would a board member want to know, and you will produce more relevant content.
(If you are saying “but of course” in your head, you are not alone. We can’t take our own advice)